RSS

Canadian real GDP inched up 0.1 per cent in February, following a 0.6 per cent jump in January. Both goods-producing and services-providing sectors of the economy grew 0.1 per cent. Growth was led by the public sector (+0.2 per cent), professional, scientific and technical services (+0.6 per cent), and construction activity (+0.3 per cent). Canadian real GDP is now roughly 3.4 per cent above its pre-pandemic, February 2020 level. Preliminary estimates suggest that output in the Canadian economy declined 0.1 per cent in March, implying an annualized growth rate of 2.5 per cent in the first quarter.

On the heels of unexpectedly high real GDP growth in January, February's low figure, alongside preliminary data indicating a slight contraction in March, appears more consistent with the Bank of Canada's expectations for slowing economic growth in 2023. Growth was softer than expected in the fourth quarter of 2022, supporting the Bank of Canada's 'conditional pause' on further rate hikes, and ignoring January, this slowness appears to be continuing in February and March. Due to the long lag of monetary policy, the effects of last year's tightening are still working their way through the economy, and further slowing in GDP and the labour market is anticipated in the second half of 2023. This slowing of growth is likely good news for inflation, which has been trending close to the bank's 2 per cent target in recent months. The next Bank of Canada rate announcement is on June 7th. 

Read

Canadian housing starts fell 11 per cent to 213,865 units in March at a seasonally-adjusted annual rate (SAAR). Starts were down 12 per cent from March of 2022. Single-detached housing starts fell 12 per cent to 56,468 units, while multi-family and others fell 11 per cent to 157,395 (SAAR). 

In British Columbia, starts rose by 35 per cent in March to 51,564 units SAAR in all areas of the province. In areas in the province with 10,000 or more residents, single-detached starts fell 10 per cent m/m to 4,814 units while multi-family starts rose 49 per cent to 43,180 units. Starts in the province were 60 per cent above the levels from March 2022. Starts were up by 18k in Vancouver and 0.3k in Victoria, while declining by 2.6k in Kelowna and 0.8k in Abbotsford. The 6-month moving average trend fell 0.7 per cent to 48.6k in BC in November. 


Read

Canadian prices, as measured by the Consumer Price Index (CPI), rose 4.3 per cent on a year-over-year basis in March, a decrease from the 5.2 per cent rate in February. This large drop was mostly due to base year effects; the CPI was rising quickly this month last year and fuel prices in particular are substantially down from a year ago. Grocery prices continue to rise quickly, up 9.7 per cent from last year, following seven consecutive months of double-digit increases. Mortgage interest costs were up 26.4 per cent year-over-year, the fastest pace on record, as Canadians renewed or initiated higher-rate mortgages. In contrast, the Homeowner's Replacement Cost, which tracks home prices, continued to slow, increasing 1.7 per cent year-over-year in March, down from 3.3 per cent in February. Month-over-month, on a seasonally-adjusted basis, prices were up 0.1 per cent in March. In BC, consumer prices rose 4.7 per cent year-over-year.

There continue to be encouraging signs that the bout of rapid price appreciation that began in February of last year is waning. Although food prices and mortgage interest costs continue to rise quickly, most other categories in the index are trending back toward normal price trends. Indeed, excluding mortgage costs, the year-over-year change in CPI was just 3.6 per cent. The Bank of Canada's measures of core inflation, which strip out volatile components, each ticked downwards for a fourth month in a row. The three-month annualized change in seasonally-adjusted CPI is now well within the bank's 1-3 per cent target range, hitting 2.1 per cent in March. Still, although year-over-year price appreciation may be moderating, at 4.3 per cent it is still well above the Bank of Canada's 2 per cent target. While the Bank of Canada held the overnight rate steady at 4.5 per cent for a second consecutive meeting in April, the Bank could change course if inflation does not continue to cool or if the economy dips toward recession. 


Read

The Bank of Canada maintained its overnight rate at 4.5 per cent this morning. In the statement accompanying the decision the Bank noted that demand in Canada still exceeds supply and labour markets remain tight and that first quarter economic growth looks stronger than expected. However, the bank expects consumption growth to slow this year as households renew mortgages at higher rates and growth in exports and investment will decline as the US economy slows substantially in coming months. On inflation, the Bank expects headline CPI inflation to fall to 3 per cent in the middle of this year before declining gradually to 2 per cent by the end of 2024. However, the Bank warned getting inflation back to 2 per cent will be challenging given still high inflation expectations, elevated service sector prices and strong wage growth.

The Bank of Canada has moved to the sidelines while it judges the past year's impact of rate increases on inflation. Several factors point to inflation beginning to normalize this year. Barring a significant shift, gas prices are starting to subtract from year-over-year CPI inflation and raw materials and shipping costs should benefit from a downtrend in global commodity prices and a normalization of supply chains. The open question for the economy remains whether a recession is likely to occur this year. Given the pace and magnitude of tightening by the Bank of Canada, and signals from traditional recession warning tools like the slope of the yield curve, the recession probability remains elevated, particularly given added uncertainty stemming from failures in the US banking sector. However, growth has remained firmer than expected and the economy continues to create jobs at a robust pace.  Still, high interest rates will start to drag on the broader economy this year and slower growth and significant progress on inflation should keep the Bank sidelined with the possibility of a rate cut in early 2024.
Read

Canadian employment rose slightly to 20.08 million in March, up by 35,000 (0.2 per cent). The Canadian unemployment rate held steady at 5 per cent, hovering just above all-time lows. Employment gains were concentrated in transportation and warehousing (+41,000); business, building and other support services (+31,000); and finance, insurance, real estate, rental and leasing (+19,000). Average hourly wages were up 5.3 per cent from March of last year, while total hours worked were up 1.6 per cent year-over-year. 

Employment in BC was unchanged in March, along with Metro Vancouver. However, the unemployment rate in BC fell to 4.5 per cent and in Metro Vancouver to 4.8 per cent. This reversed the jump in unemployment last month caused by increased labour force participation. Only Quebec currently has a lower unemployment rate than BC. 


Read

Home prices across Metro Vancouver’s housing market showed modest increases in March, while new listings remained below long-term historical averages.  


March data also indicates home sales are making a stronger than expected spring showing so far, despite elevated borrowing costs. 


The Real Estate Board of Greater Vancouver (REBGV) reports that residential home sales in the region totalled 2,535 in March 2023, a 42.5 per cent decrease from the 4,405 sales recorded in March 2022, and 28.4 per cent below the 10-year seasonal average (3,540). 


The MLS® Home Price Index composite benchmark price for all residential properties in Metro Vancouver is currently $1,143,900. This represents a 9.5 per cent decrease over March 2022 and a 1.8 per cent increase compared to February 2023. 


“On the pricing side, the spring market is already on track to outpace our 2023 forecast, which anticipated modest price increases of about one to two per cent across all product types,” Andrew Lis, REBGV’s director of economics and data analytics said. “The surprising part of this recent activity is that these price increases are occurring against a backdrop of elevated borrowing costs, below-average sales, and new listing activity that continues to suggest that sellers are awaiting more favorable market conditions.” 


There were 4,317 detached, attached and apartment properties newly listed for sale on the Multiple Listing Service® (MLS®) in Metro Vancouver in March 2023. This represents a 35.5 per cent decrease compared to the 6,690 homes listed in March 2022, and was 22.3 per cent below the 10-year seasonal average (5,553). 


The total number of homes currently listed for sale on the MLS® system in Metro Vancouver is 8,617, an 8.1 per cent increase compared to March 2022 (7,970), and 17.3 per cent below the 10-year seasonal average (10,421). 


Across all detached, attached and apartment property types, the sales-to-active listings ratio for March 2023 is 30.7 per cent. By property type, the ratio is 23.3 per cent for detached homes, 36.7 per cent for townhomes, and 34.9 per cent for apartments. 


Analysis of historical data suggests downward pressure on home prices occurs when the ratio dips below 12 per cent for a sustained period, while home prices often experience upward pressure when it surpasses 20 per cent over several months. 


“If home sellers remain on the sidelines, monthly MLS® sales figures will continue to appear lower than historical averages as we move toward summer,” Lis said. “But it’s important to recognize the chicken-and-egg nature of these statistics. The number of sales in any given month is partially determined by the number of homes that come to market that month, along with the inventory of unsold homes listed in previous months. With fewer homes coming on the market, homes sales will remain lower than we’re accustomed to seeing at this point in the year, almost entirely by definition.” 


Sales of detached homes in March 2023 reached 734, a 43.6 per cent decrease from the 1,302 detached sales recorded in March 2022. The benchmark price for detached properties is $1,861,800. This represents an 11.2 per cent decrease from March 2022 and a 2.7 per cent increase compared to February 2023. 


Sales of apartment homes reached 1,311 in March 2023, a 43.2 per cent decrease compared to the 2,310 sales in March 2022. The benchmark price of an apartment property is $737,400. This represents a 4.6 per cent decrease from March 2022 and a 0.7 per cent increase compared to February 2023. 


Attached home sales in March 2023 totalled 466, a 37.3 per cent decrease compared to the 743 sales in March 2022. The benchmark price of an attached unit is $1,056,400. This represents a 7.8 per cent decrease from March 2022 and a 1.7 per cent increase compared to February 2023. 

Read

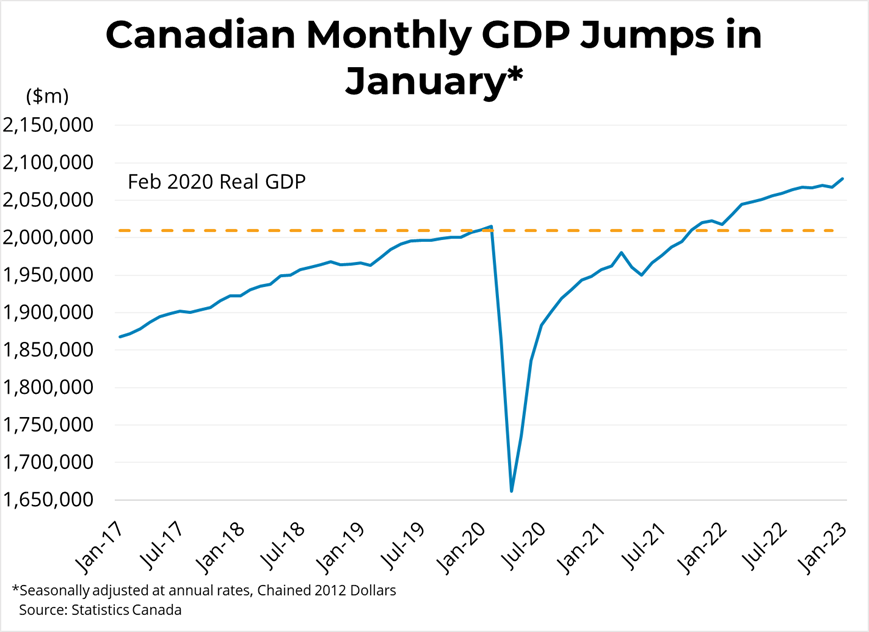
Canadian real GDP jumped 0.5 per cent in January, falling a 0.1 per cent contraction in December. The rise in GDP was spread across both goods-producing industries (+0.4 per cent) and services-producing industries (+0.6 per cent). Growth was led by a rebound in oil sands extraction after unplanned maintenance in December, coal exports to China, durable goods manufacturing, and construction activity. Canadian real GDP is now roughly 3.2 per cent above its pre-pandemic, February 2020 level. Preliminary estimates suggest that output in the Canadian economy rose 0.3 per cent in February.

The large jump in GDP in January bucked expectations of continued slowing as tighter monetary policy worked its way through the Canadian economy. Growth was softer than expected in the fourth quarter of 2022, supporting the Bank of Canada's 'conditional pause' on further rate hikes. In contrast, this month's strong number would normally bias the Bank of Canada toward additional monetary tightening, but progress on bringing down inflation, alongside the lingering uncertainty stemming from bank failures in the United States, will likely keep the Bank on hold. With employment markets remaining tight but inflation appearing to soften, the Bank will be weighing the evidence before its next rate announcement on April 12th.


Read

Canadian seasonally-adjusted retail sales rose 1.4 per cent in January to $66.4 billion. Sales rose in 7 of 9 subsectors, but were led by higher sales at motor vehicle and parts dealers (+3 per cent) and gasoline and fuel vendors (+2.9 per cent). Core retail sales, which strips out gasoline and motor vehicle and parts dealers, rose 0.5 per cent. In volume terms, sales rose 1.5 per cent in January. As of January 2023, Statistics Canada broadened and modified its definition of Retail Trade, making the current series not precisely comparable with the previous series. 

In BC, seasonally-adjusted sales rose 1.8 per cent in January. Compared to the same month last year, retail sales were up 3.3 per cent in the province. In the Greater Vancouver region, sales rose 3.4 per cent month-over-month and were up 3.2 per cent year-over-year. 


Read

Canadian prices, as measured by the Consumer Price Index (CPI), rose 5.2 per cent on a year-over-year basis in February, a decrease from the 5.9 per cent rate in January. This large drop was mostly due to base year effects, as inflation increased strongly this month last year. Grocery prices continue to rise too-quickly, up 10.6 per cent from last year, the seventh consecutive month of double-digit annual price growth. Mortgage interest costs were up 23.9 per cent year-over-year, the fastest pace since 1982, as Canadians renewed or initiated higher-rate mortgages. In contrast, the Homeowner's Replacement Cost, which tracks home prices, continued to slow, increasing 3.3 per cent year-over-year in February, down from 4.3 per cent in January. Month-over-month, on a seasonally-adjusted basis, prices were up 0.1 per cent in February. In BC, consumer prices rose 6.2 per cent year-over-year.

There continue to be encouraging signs that the bout of rapid price appreciation that began in February of last year is waning. Although food prices continue to rise quickly, most other categories in the index are trending back toward normal price trends. The Bank of Canada's measures of core inflation, which strip out volatile components, each ticked downwards for a third month in a row. The three-month annualized change in seasonally-adjusted CPI is now well within the bank's 1-3 per cent target range, hitting 1.6 per cent in February. Although price appreciation may be moderating, it is still well above the Bank of Canada's 2 per cent target, and while the Bank has announced a conditional pause on further rate hikes, they could change course if inflation does not continue to cool. 


Read

A weekend getaway at Harrison Lake
Spent the past weedend with family and friends at the lakehouse, weather was nice and the view was spectacular! If you are looking for a lakehouse with view like this, contact me!
Read

Canadian housing starts rose 13 per cent to 243,959 units in February at a seasonally-adjusted annual rate (SAAR). Starts were down 2 per cent from February of 2022. Single-detached housing starts rose 2 per cent to 64,281 units, while multi-family and others rose 17 per cent to 179,677 (SAAR). 

In British Columbia, starts fell by 25 per cent in February to 37,389 units SAAR in all areas of the province. In areas in the province with 10,000 or more residents, single-detached starts fell 9 per cent m/m to 5,308 units while multi-family starts fell 30 per cent to 28,367 units. Starts in the province were 8 per cent above the levels from February 2022. Starts were up by 1.1k in Kelowna and 1k in Abbotsford, while falling 2k in Victoria and 14k in Vancouver from last month. The 6-month moving average trend fell 3.8 per cent to 48.8k in BC in November. 


Link: https://mailchi.mp/bcrea/canadian-housing-starts-february-2023
Read
Categories:   Arbutus Real Estate | Arbutus, Vancouver West Real Estate | Boyd Park Real Estate | Brentwood Park, Burnaby North Real Estate | Brighouse Real Estate | Brighouse, Richmond Real Estate | Cambie, Vancouver West Real Estate | Coal Harbour Real Estate | Coal Harbour, Vancouver West Real Estate | Coquitlam West, Coquitlam Real Estate | Downtown VW Real Estate | Downtown VW, Vancouver West Real Estate | Dunbar Real Estate | Edmonds BE, Burnaby East Real Estate | Grandview Surrey Real Estate | Grandview Woodland Real Estate | Guildford Real Estate | Guildford, North Surrey Real Estate | Kerrisdale Real Estate | Kitsilano Real Estate | Langley City Real Estate | Langley City, Langley Real Estate | Marpole Real Estate | Marpole, Vancouver West Real Estate | McLennan North Real Estate | McLennan North, Richmond Real Estate | Metrotown Real Estate | Metrotown, Burnaby South Real Estate | Morgan Creek, South Surrey White Rock Real Estate | Point Grey Real Estate | Queensborough, New Westminster Real Estate | Riverdale RI Real Estate | Saunders, Richmond Real Estate | Scottsdale Real Estate | South Vancouver, Vancouver East Real Estate | Southlands Real Estate | Steveston North Real Estate | Steveston North, Richmond Real Estate | Steveston South Real Estate | Steveston Village Real Estate | Tsawwassen North, Tsawwassen Real Estate | University VW Real Estate | University VW, Vancouver West Real Estate | Vancouver West Real Estate | West Cambie Real Estate | West Cambie, Richmond Real Estate | West End VW Real Estate | Whalley Real Estate
Reciprocity Logo The data relating to real estate on this website comes in part from the MLS® Reciprocity program of either the Greater Vancouver REALTORS® (GVR), the Fraser Valley Real Estate Board (FVREB) or the Chilliwack and District Real Estate Board (CADREB). Real estate listings held by participating real estate firms are marked with the MLS® logo and detailed information about the listing includes the name of the listing agent. This representation is based in whole or part on data generated by either the GVR, the FVREB or the CADREB which assumes no responsibility for its accuracy. The materials contained on this page may not be reproduced without the express written consent of either the GVR, the FVREB or the CADREB.