Posted on
May 31, 2023
by
JEFF QIAN
Canadian real GDP was flat in March. Service-producing industries were unchanged from the prior month which goods producing industries edged down 0.1 per cent. Canadian real GDP is now roughly 3.6 per cent above its pre-pandemic, February 2020 level. Preliminary estimates suggest that output in the Canadian economy rose 0.2 per cent in April.GDP grew 0.8 per cent in the first quarter of 2023, following roughly zero growth in the previous quarter. Almost all of this growth was concentrated in the month of January. Goods-producing sectors rose 0.1 per cent while services-producing sectors rose 0.9 per cent. The public sector (educational services, health care and social assistance, and public administration) was the largest contributor to growth for the third consecutive quarter. Exports rose 2.4 per cent in the first quarter, while imports rose just 0.2 per cent, spurring growth. Higher household spending on goods (1.5 per cent) and services (1.3 per cent) also pushed GDP upwards. Higher borrowing costs, meanwhile, caused housing investment to fall 3.9 per cent in the first quarter, with new construction (-6.0 per cent), renovations (-2.1 per cent), and ownership transfer costs (-1.5 per cent) all declining. Compensation of employees rose 1.7 per cent from the prior quarter, but disposable income nevertheless fell 1 per cent largely as a result of lower government transfers compared to last quarter. Canadian GDP outpaced expectations in the first quarter, expanding 3.1 per cent on an annualized basis. Following over a year of rate hikes from the Bank of Canada, the economy remains robust in many areas. A burst of economic growth at the start of the year supported a high first quarter growth rate, but April's preliminary GDP estimate shows growth continuing into the second quarter. Although housing markets swooned in the immediate aftermath of rate hikes, in recent months they have shown signs of a solid recovery. At 5 per cent, the Canadian unemployment rate remains near record lows. Meanwhile, inflation remains hot, with the year-over-year rate increasing to 4.4 per cent in April from 4.3 per cent in March. These indicators will put some pressure on the central bank to potentially change course following its 'conditional pause' on further rate hikes as of January. The Bank's rate decision next Wednesday will need to balance persistently hot numbers with the risk of overtightening given the long lags of monetary policy. 
Posted on
May 16, 2023
by
JEFF QIAN
Canadian prices, as measured by the Consumer Price Index (CPI), rose 4.4 per cent on a year-over-year basis in April, a slight increase from the 4.3 per cent rate in March. Month over month, CPI rose 0.7 per cent, in large part due to higher gasoline prices, which jumped 6.3 per cent from last month. Shelter costs were up 4.9 per cent year over year, driven by much higher mortgage interest costs (up 28.5 per cent from last year) along with higher rents (up 6.1 per cent from April 2022). The homeowner's replacement cost, which tracks home prices, was up just 0.2 per cent year over year. Grocery prices were up 9.1 per cent year over year, down from 9.7 per cent last month. In BC, consumer prices rose 4.3 per cent year-over-year.After rapid success in bringing down inflation since last fall, month-over-month CPI figures came in hotter than expected in April. Even after stripping out the large jump in gasoline prices, CPI rose 0.5 per cent from March, corresponding to a 6 per cent annualized rate, while food and shelter costs continue to rise faster than a 6 percent annualized rate. The Bank of Canada's measures of core inflation, which strip out volatile components, each fell on a year-over-year basis while rising month-over-month. Markets continue to expect the bank to hold its overnight rate steady at 4.5 per cent at their upcoming meeting on June 7th. However, in the context of a still strong labour market and the early signs of a rebound in the housing market, these CPI figures suggest that the Bank of Canada is still not entirely out of the woods on inflation.

Posted on
May 15, 2023
by
JEFF QIAN
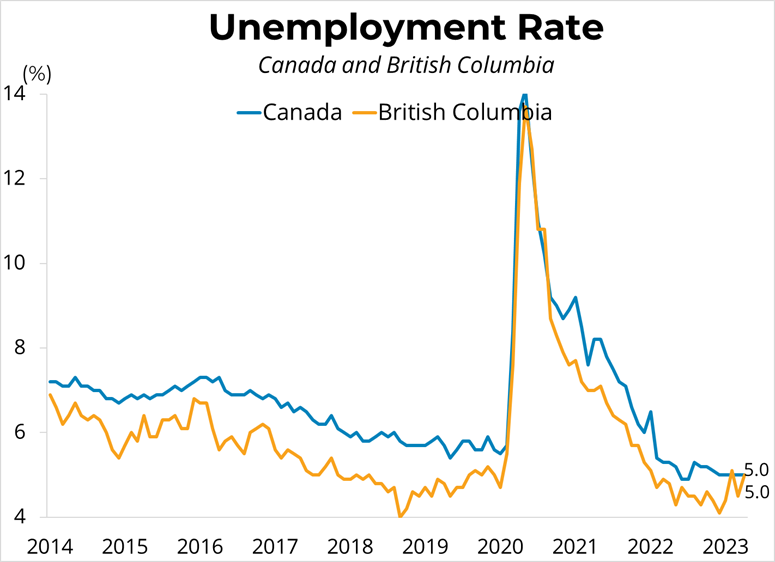
Canadian employment rose slightly to 20.13 million in April, up by 41,400 (0.2 per cent). The Canadian unemployment rate held steady at 5 per cent, unchanged since December. Employment gains were concentrated in wholesale and retail trade (+24,000); transportation and warehousing (+17,000); and information, culture and recreation (+16,000). Average hourly wages were up 5.2 per cent from April of last year.Employment in BC was little changed in April, rising 0.1 per cent to 2.78 million, while declining by 0.1 per cent in Metro Vancouver to 1.564 million. The unemployment rate rose to 5 per cent in BC and to 5.4 per cent in Metro Vancouver. The rise was driven both by a rise in labour force participation, but also an increase in the number of unemployed workers. 

Posted on
May 15, 2023
by
JEFF QIAN
Canadian housing starts rose 22 per cent to 261,559 units in April at a seasonally-adjusted annual rate (SAAR). Starts were up 0.5 per cent from April of 2022. Single-detached housing starts fell 4 per cent to 53,843 units, while multi-family and others rose 32 per cent to 207,715 (SAAR). In British Columbia, starts rose by 18 per cent in April to 60,633 units SAAR in all areas of the province. In areas in the province with 10,000 or more residents, single-detached starts rose 14 per cent m/m to 5,676 units while multi-family starts rose 21 per cent to 52,420 units. Starts in the province were 13 per cent above the levels from April 2022. Starts were up by 13k in Vancouver, while declining by 2.9k in Victoria and 1.8k in Kelowna. Starts in Abbotsford were flat month over month. The 6-month moving average trend rose 5.3 per cent to 51.2k in BC in November. 

Posted on
May 8, 2023
by
JEFF QIAN
Canadian employment rose slightly to 20.13 million in April, up by 41,400 (0.2 per cent). The Canadian unemployment rate held steady at 5 per cent, unchanged since December. Employment gains were concentrated in wholesale and retail trade (+24,000); transportation and warehousing (+17,000); and information, culture and recreation (+16,000). Average hourly wages were up 5.2 per cent from April of last year.Employment in BC was little changed in April, rising 0.1 per cent to 2.78 million, while declining by 0.1 per cent in Metro Vancouver to 1.564 million. The unemployment rate rose to 5 per cent in BC and to 5.4 per cent in Metro Vancouver. The rise was driven both by a rise in labour force participation, but also an increase in the number of unemployed workers. 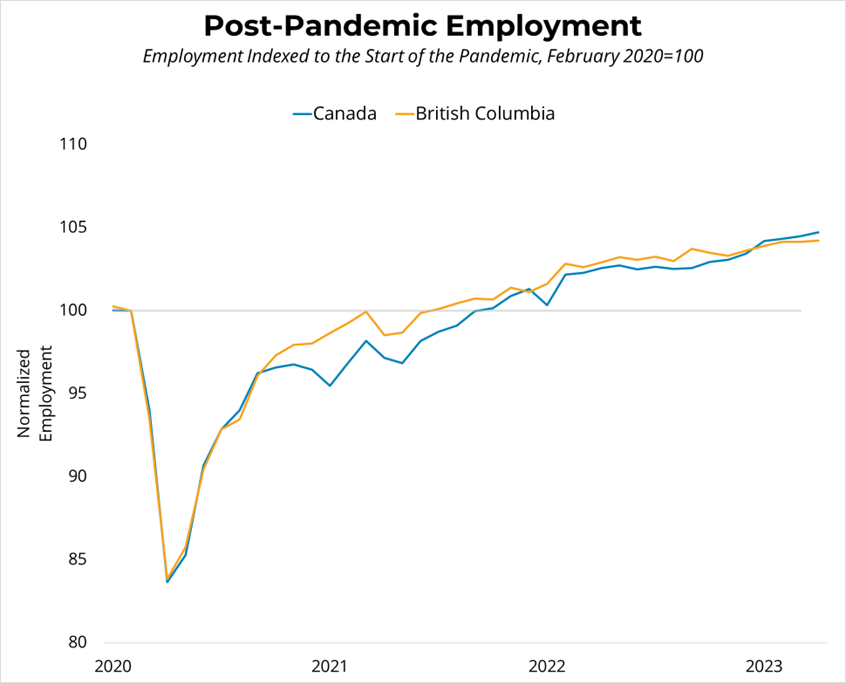
Posted on
May 5, 2023
by
JEFF QIAN
I have listed a new property at 20836 52 AVE in Langley. See details here
Huge 9,030 sq ft lot in a prime Langley location close to shopping, schools, transit and all amenities. Land Assembly/Development Potential! Sited for ground orientated residential Duplex/4 plex/6 plex row houses.
Posted on
May 1, 2023
by
JEFF QIAN
Canadian real GDP inched up 0.1 per cent in February, following a 0.6 per cent jump in January. Both goods-producing and services-providing sectors of the economy grew 0.1 per cent. Growth was led by the public sector (+0.2 per cent), professional, scientific and technical services (+0.6 per cent), and construction activity (+0.3 per cent). Canadian real GDP is now roughly 3.4 per cent above its pre-pandemic, February 2020 level. Preliminary estimates suggest that output in the Canadian economy declined 0.1 per cent in March, implying an annualized growth rate of 2.5 per cent in the first quarter.On the heels of unexpectedly high real GDP growth in January, February's low figure, alongside preliminary data indicating a slight contraction in March, appears more consistent with the Bank of Canada's expectations for slowing economic growth in 2023. Growth was softer than expected in the fourth quarter of 2022, supporting the Bank of Canada's 'conditional pause' on further rate hikes, and ignoring January, this slowness appears to be continuing in February and March. Due to the long lag of monetary policy, the effects of last year's tightening are still working their way through the economy, and further slowing in GDP and the labour market is anticipated in the second half of 2023. This slowing of growth is likely good news for inflation, which has been trending close to the bank's 2 per cent target in recent months. The next Bank of Canada rate announcement is on June 7th. 
Categories:
Arbutus Real Estate
|
Arbutus, Vancouver West Real Estate
|
Boyd Park Real Estate
|
Brentwood Park, Burnaby North Real Estate
|
Brighouse Real Estate
|
Brighouse, Richmond Real Estate
|
Cambie, Vancouver West Real Estate
|
Coal Harbour Real Estate
|
Coal Harbour, Vancouver West Real Estate
|
Coquitlam West, Coquitlam Real Estate
|
Downtown VW Real Estate
|
Downtown VW, Vancouver West Real Estate
|
Dunbar Real Estate
|
Edmonds BE, Burnaby East Real Estate
|
Grandview Surrey Real Estate
|
Grandview Woodland Real Estate
|
Guildford Real Estate
|
Guildford, North Surrey Real Estate
|
Kerrisdale Real Estate
|
Kitsilano Real Estate
|
Langley City Real Estate
|
Langley City, Langley Real Estate
|
Marpole Real Estate
|
Marpole, Vancouver West Real Estate
|
McLennan North Real Estate
|
McLennan North, Richmond Real Estate
|
Metrotown Real Estate
|
Metrotown, Burnaby South Real Estate
|
Morgan Creek, South Surrey White Rock Real Estate
|
Point Grey Real Estate
|
Queensborough, New Westminster Real Estate
|
Riverdale RI Real Estate
|
Saunders, Richmond Real Estate
|
Scottsdale Real Estate
|
South Vancouver, Vancouver East Real Estate
|
Southlands Real Estate
|
Steveston North Real Estate
|
Steveston North, Richmond Real Estate
|
Steveston South Real Estate
|
Steveston Village Real Estate
|
Tsawwassen North, Tsawwassen Real Estate
|
University VW Real Estate
|
University VW, Vancouver West Real Estate
|
Vancouver West Real Estate
|
West Cambie Real Estate
|
West Cambie, Richmond Real Estate
|
West End VW Real Estate
|
Whalley Real Estate

The data relating to real estate on this website comes in part from the MLS® Reciprocity program of either the Greater Vancouver REALTORS® (GVR), the Fraser Valley Real Estate Board (FVREB) or the Chilliwack and District Real Estate Board (CADREB). Real estate listings held by participating real estate firms are marked with the MLS® logo and detailed information about the listing includes the name of the listing agent. This representation is based in whole or part on data generated by either the GVR, the FVREB or the CADREB which assumes no responsibility for its accuracy. The materials contained on this page may not be reproduced without the express written consent of either the GVR, the FVREB or the CADREB.